Jurij Stare
Light Pollution Map
Light Pollution Map ist eine App von Jurij Stare. Veröffentlicht 5 years ago. 1.1.39 Version.
Teilen
Diese App weiterempfehlen
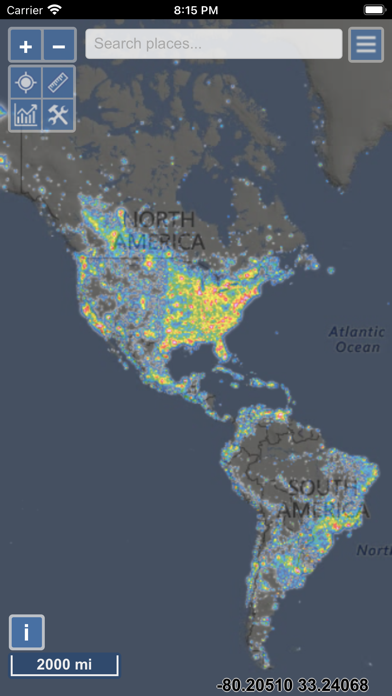
The map displays VIIRS/World Atlas/Clouds/Aurora/IAU observatories and the user SQM measurements.
The primary use is to show VIIRS/DMSP data in a friendly manner, but over time it also included some other interesting overlays that concern light pollution like SQM/SQC, World Atlas 2015 zenith brightness, clouds, aurora and IAU observatories. If you have a permanent SQM reader installed you can add it to the map by sending me an e-mail.
Please send comments and requests for new features via email (look under help)
Functionalities:
- VIIRS, Sky Brightness, World Atlas 2015, Cloud coverage and Aurora forecast layers
- VIIRS and Sky Brightness layers can be displayed in color blind friendly colors
- Road & Satellite base maps
- Cloud animation for the last 12 hours
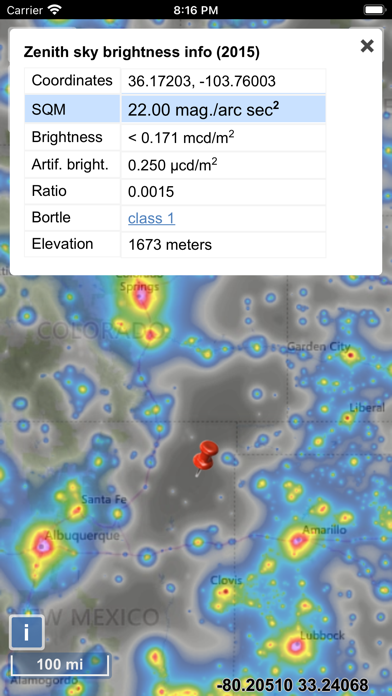
- Get detail radiance and SQM values from layers at a click. For Sky brightness/World Atlas 2015, you also get Bortle class estimation.
- SQM, SQM-L, SQC, SQM-LE, SQM readings submitted by users
- International dark sky parks overlay
- Submit your own SQM (L) readings
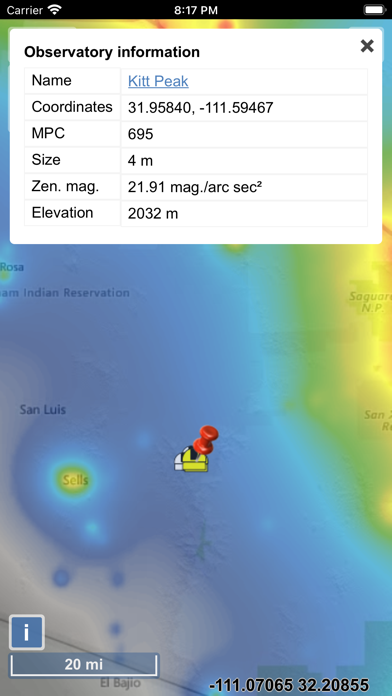
- Observatories layer
- Save your favorite locations
- Distance measurement tool with azimuth angle report
- All-sky view of light pollution with real horizon
- Offline mode (Sky brightness map and a base map are saved to your device, so it will be displayed when you are offline)
The primary use is to show VIIRS/DMSP data in a friendly manner, but over time it also included some other interesting overlays that concern light pollution like SQM/SQC, World Atlas 2015 zenith brightness, clouds, aurora and IAU observatories. If you have a permanent SQM reader installed you can add it to the map by sending me an e-mail.
Please send comments and requests for new features via email (look under help)
Functionalities:
- VIIRS, Sky Brightness, World Atlas 2015, Cloud coverage and Aurora forecast layers
- VIIRS and Sky Brightness layers can be displayed in color blind friendly colors
- Road & Satellite base maps
- Cloud animation for the last 12 hours
- Get detail radiance and SQM values from layers at a click. For Sky brightness/World Atlas 2015, you also get Bortle class estimation.
- SQM, SQM-L, SQC, SQM-LE, SQM readings submitted by users
- International dark sky parks overlay
- Submit your own SQM (L) readings
- Observatories layer
- Save your favorite locations
- Distance measurement tool with azimuth angle report
- All-sky view of light pollution with real horizon
- Offline mode (Sky brightness map and a base map are saved to your device, so it will be displayed when you are offline)
Smart erkannt
App-Funktionen
Automatisch aus Beschreibung, Titel und Kategorie erkannt.
🗺️
Interaktive Karten
👍
Likes & Reaktionen
💭
Kommentare & Bewertungen
☁️
Cloud-Synchronisation
📦
Offline-Modus
🌐
Mehrsprachige Oberfläche