Krueger Systems, Inc.
Live Spectrogram
Live Spectrogram ist eine App von Krueger Systems, Inc.. Veröffentlicht 13 years ago. 1.3 Version.
Teilen
Diese App weiterempfehlen
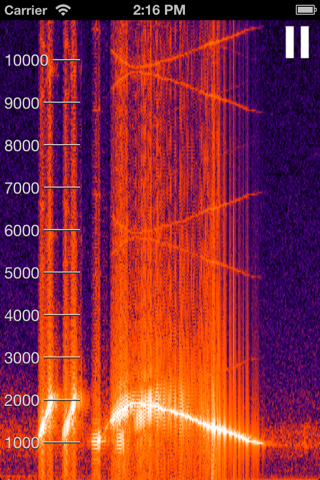
Visualize audio with this handy tool.
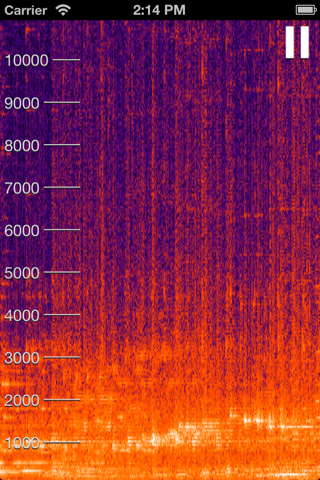
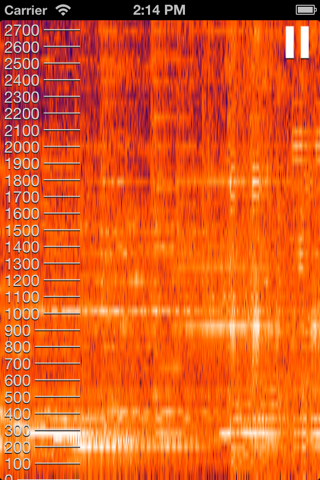
It displays the frequencies of sound around you over time. The horizontal axis is time, the vertical is frequency, and the intensity of frequencies is shown using pretty shades of red.
Use it to:
Perfect your singing voice
Analyze the call of animals
Identify and locate annoying sounds around your house
Learn about the world of frequency analysis
I hope you enjoy this handy little tool!
Smart erkannt
App-Funktionen
Automatisch aus Beschreibung, Titel und Kategorie erkannt.
🔍
Objekterkennung
🎵
Hintergrundmusik & Audio
📡
Echtzeit-Daten
📊
Statistiken & Analysen